Last year's school cut-off is no safe guide
How the last distance offered moved at 358 oversubscribed state secondaries in England between National Offer Day 2025 and 2026 · Catchmently analysis of council figures · September 2026
Parents are told to check a school's "last distance offered": how far from the school the last child offered a place by distance lived. Many use it to choose schools, and some to decide where to rent or buy. The councils' own figures show it is a moving target.
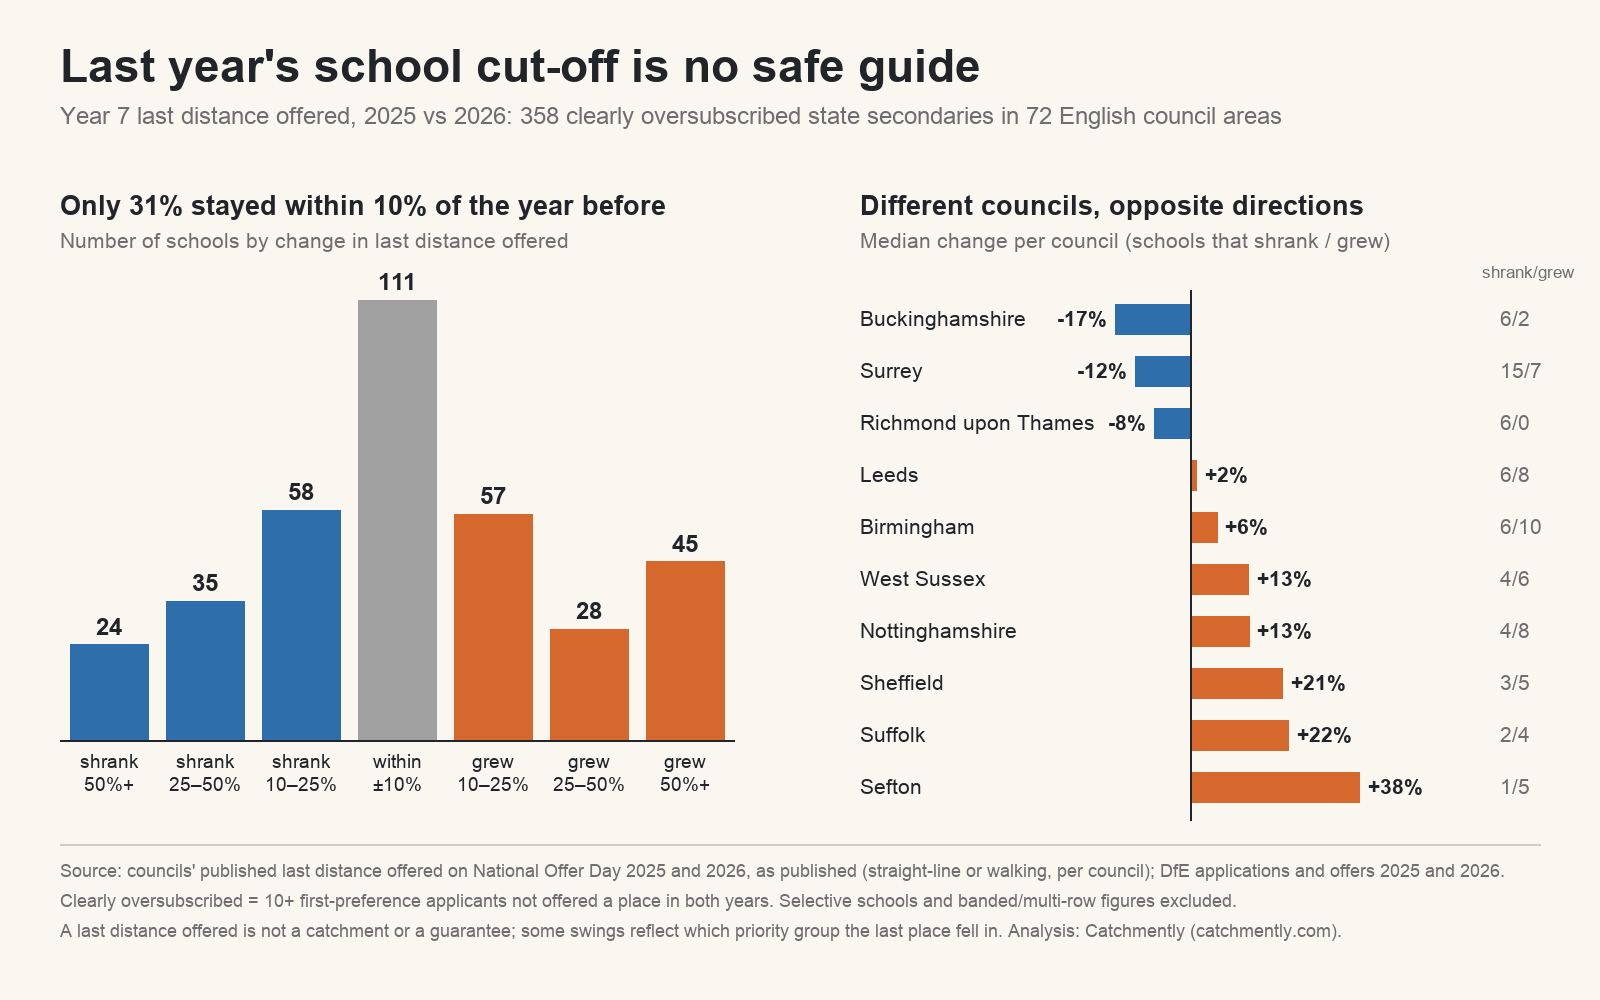
Key findings: Year 7, 2025 compared with 2026
We looked at 358 non-selective state secondaries in 72 council areas where at least 10 first-preference applicants were not offered a place in both years.
- Only 31% (111 schools) had a last distance offered within 10% of the previous year's. 69% moved by 10% or more.
- More than a third (132 schools) moved by a quarter or more, and 69 schools moved by half or more.
- It cut both ways: 161 schools' distances shrank and 184 grew. Only 13 were effectively unchanged.
- The typical school's distance moved by 17%, or about 400 metres, in one year.
- Primary is even more volatile. Of 177 clearly oversubscribed primary schools in 63 council areas, half saw their Reception last distance offered move by a quarter or more (typical move 25%, about 240 metres).
It depends where you live
Neighbouring areas moved in opposite directions. All 29 councils with at least 5 schools in the analysis; open a council for its school-by-school breakdown:
| Council | Schools | Shorter | Longer | Median change |
|---|---|---|---|---|
| Buckinghamshire | 9 | 6 | 2 | −17% |
| Surrey | 24 | 15 | 7 | −12% |
| Luton | 7 | 5 | 2 | −10% |
| Havering | 7 | 4 | 3 | −9% |
| Hertfordshire | 8 | 4 | 4 | −8% |
| Richmond upon Thames | 6 | 6 | 0 | −8% |
| Solihull | 9 | 5 | 4 | −3% |
| Bournemouth, Christchurch and Poole | 6 | 4 | 2 | −3% |
| Bromley | 6 | 3 | 3 | −3% |
| Milton Keynes | 6 | 3 | 3 | −2% |
| Gloucestershire | 11 | 6 | 4 | −2% |
| Tameside | 6 | 3 | 2 | −2% |
| Kirklees | 7 | 3 | 3 | −0% |
| Bradford | 10 | 5 | 5 | +1% |
| Leeds | 14 | 6 | 8 | +2% |
| Hillingdon | 7 | 3 | 4 | +2% |
| Hampshire | 9 | 2 | 6 | +3% |
| Birmingham | 17 | 6 | 10 | +6% |
| Warwickshire | 13 | 5 | 8 | +8% |
| Bristol, City of | 5 | 1 | 3 | +9% |
| Coventry | 6 | 1 | 5 | +11% |
| Dudley | 5 | 2 | 3 | +13% |
| West Sussex | 10 | 4 | 6 | +13% |
| Nottinghamshire | 12 | 4 | 8 | +13% |
| Staffordshire | 5 | 2 | 3 | +14% |
| Stockport | 5 | 1 | 4 | +17% |
| Sheffield | 8 | 3 | 5 | +21% |
| Suffolk | 6 | 2 | 4 | +22% |
| Sefton | 6 | 1 | 5 | +38% |
A median close to zero can hide big moves at single schools. In Leeds, for example, Guiseley School's last distance offered was 2.464 miles in 2024, 1.604 miles in 2025 and back to 2.480 miles in 2026.
Some examples, as published
- Gordon's School, Surrey (day places): 1,532 m in 2024, 1,249 m in 2025, 910 m in 2026. A home at 1,200 m would have been inside the line two years ago and outside it this year.
- Tomlinscote School, Surrey: 4,329 m in 2025, 2,412 m in 2026.
- Holmer Green Senior School, Buckinghamshire: 2.884 miles in 2025, 1.481 miles in 2026 (distance places after catchment, siblings and other higher rules).
- Mercia School, Sheffield: 0.756 miles in 2025, 0.904 miles in 2026. Meadowhead School went the other way, 2.516 to 1.543 miles.
- Orleans Park School, Richmond: 0.946 km in 2023, 1.241 km in 2024, 1.187 km in 2025 and 1.111 km in 2026.
Why the line moves
A last distance offered is an outcome, not a boundary. It changes with the number of children in the year group and where they live, how many siblings apply (siblings usually rank above distance), which priority group the last place fell in, extra or fewer places, new housing, catchment changes and how popular a school is.
It keeps moving after offer day too. At Orleans Park the distance was 1.111 km on National Offer Day 2026 but 1.236 km by the end of coordination on 31 August, as places went to children on the waiting list. Councils say as much themselves:
"Historical distance information is only a guide as the cut-off distances vary from year-to-year. Even if you live within the cut-off distance for a previous year, there is no guarantee that your child will obtain a place at that particular school for next September."
London Borough of Richmond upon Thames, furthest distance offers 2024 to 2026
Five checks before you apply
- Look at three or more years, not just last year's figure.
- Read the admission rules. The distance applies only to the last priority group reached, for example after siblings, catchment or faith. If you are not in that group, it may not apply to you.
- Check how your council measures. Some use a straight line, others a walking route, and the council's measurement can differ from a map app.
- Use every preference and include at least one school you are very likely to be offered. Under the equal-preference system, ranking a school lower does not reduce your chance of it.
- Apply on time. Secondary applications close on 31 October 2026 and Reception applications on 15 January 2027. Late applications are usually considered only after all on-time ones.
More: primary school cut-offs 2026 · first-choice offers by council · how to read a last distance offered.
Check the schools near you
Catchmently maps every school in England with its Ofsted report, results and the admissions figures councils publish, each linked to its source. Searching is free. The one-off 3-month pass shows each school's last distance offered year by year.
Method and sources
- Figures: the last distance offered on National Offer Day 2025 and 2026 as published by each council in its admissions booklets, allocation tables and PDFs, compared in each council's own unit and way of measuring. Applications and offers are from the Department for Education's Primary and secondary school applications and offers.
- Schools included: one published figure per school, intake and year. Selective schools and schools with banded or multi-row figures (for example one figure per ability band or catchment area) are left out. "Clearly oversubscribed" means at least 10 first-preference applicants were not offered a place in both 2025 and 2026. Council medians are shown only where 6 or more schools qualify.
- Limits: a last distance offered is not a catchment area and does not show any family's chance of a place. Some large swings reflect which priority group the last place fell in, catchment changes or added places rather than demand. Coverage depends on what each council publishes.
- Council sources for the examples: Surrey County Council, allocation of secondary school places 2026 · Buckinghamshire Council, allocation profile 2026 · Sheffield City Council, oversubscribed secondary schools 2026 · Richmond upon Thames, furthest distance offers 2024 to 2026 · Leeds City Council school pages. Figures © the publishing councils; Department for Education statistics under the Open Government Licence v3.0.
Journalists and researchers: school-level tables for any council in the analysis are available from support@catchmently.com. You are welcome to use the chart with credit to Catchmently.